Total Ad Spend
$395.68
Google + Meta combined
Total Clicks
910
868 Meta + 42 Google
Purchases
42
All from Meta Ads
Leads
24
All from Meta Ads
 Ads Performance
Spend
$322.54
Clicks
868
4.30% CTR
Impressions
20,169
14,361 reach
Cost Per Purchase
$3.86
42 purchases total
| Campaign | Spend | Clicks | Leads | Purchases | CPA |
|---|---|---|---|---|---|
| Store | Sales Campaign | Teachers | $137.30 | 376 | 9 | 25 | $4.04 |
| Store | Sales Campaign | Parents | $117.70 | 337 | 15 | 17 | $3.68 |
| Blog/Songs Traffic Campaign | $23.08 | 137 | - | - | Traffic only |
| Leads Campaign | Parents | $18.67 | 2 | 0 | 0 | - |
| Leads Campaign | Parents [Local] | $18.63 | 9 | 0 | 0 | - |
| School Services | Sales Campaign | $7.16 | 7 | 0 | 0 | - |
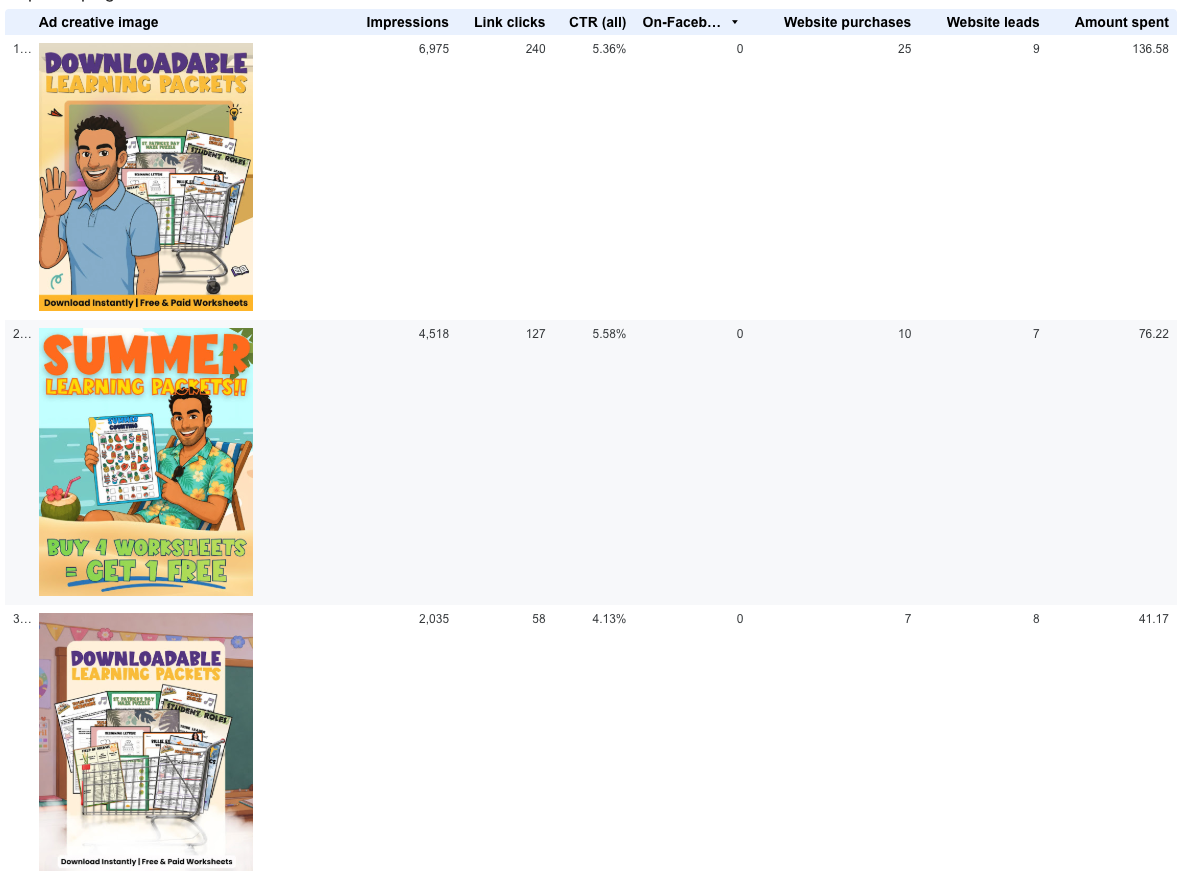
🎨 Meta Top Performing Creatives
Top ad creatives by performance during this reporting period.
 Google Ads Performance
Spend
$73.14
Clicks
42
3.03% CTR
Impressions
1,388
CPC
$1.74
Conversions
0
Optimization in progress
| Campaign | Spend | Clicks | Impressions | CTR | CPC | Conv. |
|---|---|---|---|---|---|---|
| Search | Teachertainment Store | $38.29 | 20 | 666 | 3.00% | $1.91 | 0 |
| Store | PMax | $34.85 | 22 | 722 | 3.05% | $1.58 | 0 |
🔑 Keyword Performance
| Keyword | Match | Campaign | Clicks | Impr | CTR | CPC | Spend |
|---|---|---|---|---|---|---|---|
| printable math activities | Phrase | Search | Teachertainment Store | 6 | 95 | 6.32% | $1.85 | $11.10 |
| engaging math activities | Phrase | Search | Teachertainment Store | 4 | 149 | 2.68% | $2.44 | $9.78 |
| educational printables | Phrase | Search | Teachertainment Store | 2 | 80 | 2.50% | $2.03 | $4.06 |
| 2nd grade math worksheets | Phrase | Search | Teachertainment Store | 2 | 50 | 4.00% | $1.48 | $2.96 |
| educational activities | Phrase | Search | Teachertainment Store | 2 | 73 | 2.74% | $1.70 | $3.39 |
| fun math activities | Phrase | Search | Teachertainment Store | 1 | 42 | 2.38% | $1.64 | $1.64 |
| fun activities for students | Phrase | Search | Teachertainment Store | 1 | 23 | 4.35% | $1.41 | $1.41 |
| math worksheets for kids | Phrase | Search | Teachertainment Store | 1 | 38 | 2.63% | $2.14 | $2.14 |
| educational resources for teachers | Phrase | Search | Teachertainment Store | 1 | 35 | 2.86% | $1.79 | $1.79 |
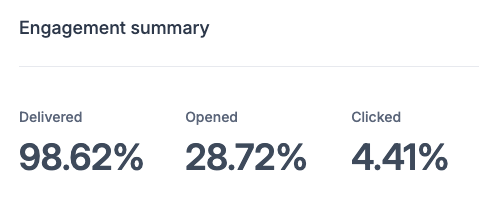
📧 Email Marketing
Independence Day email campaign sent during this period.
Email Performance Stats
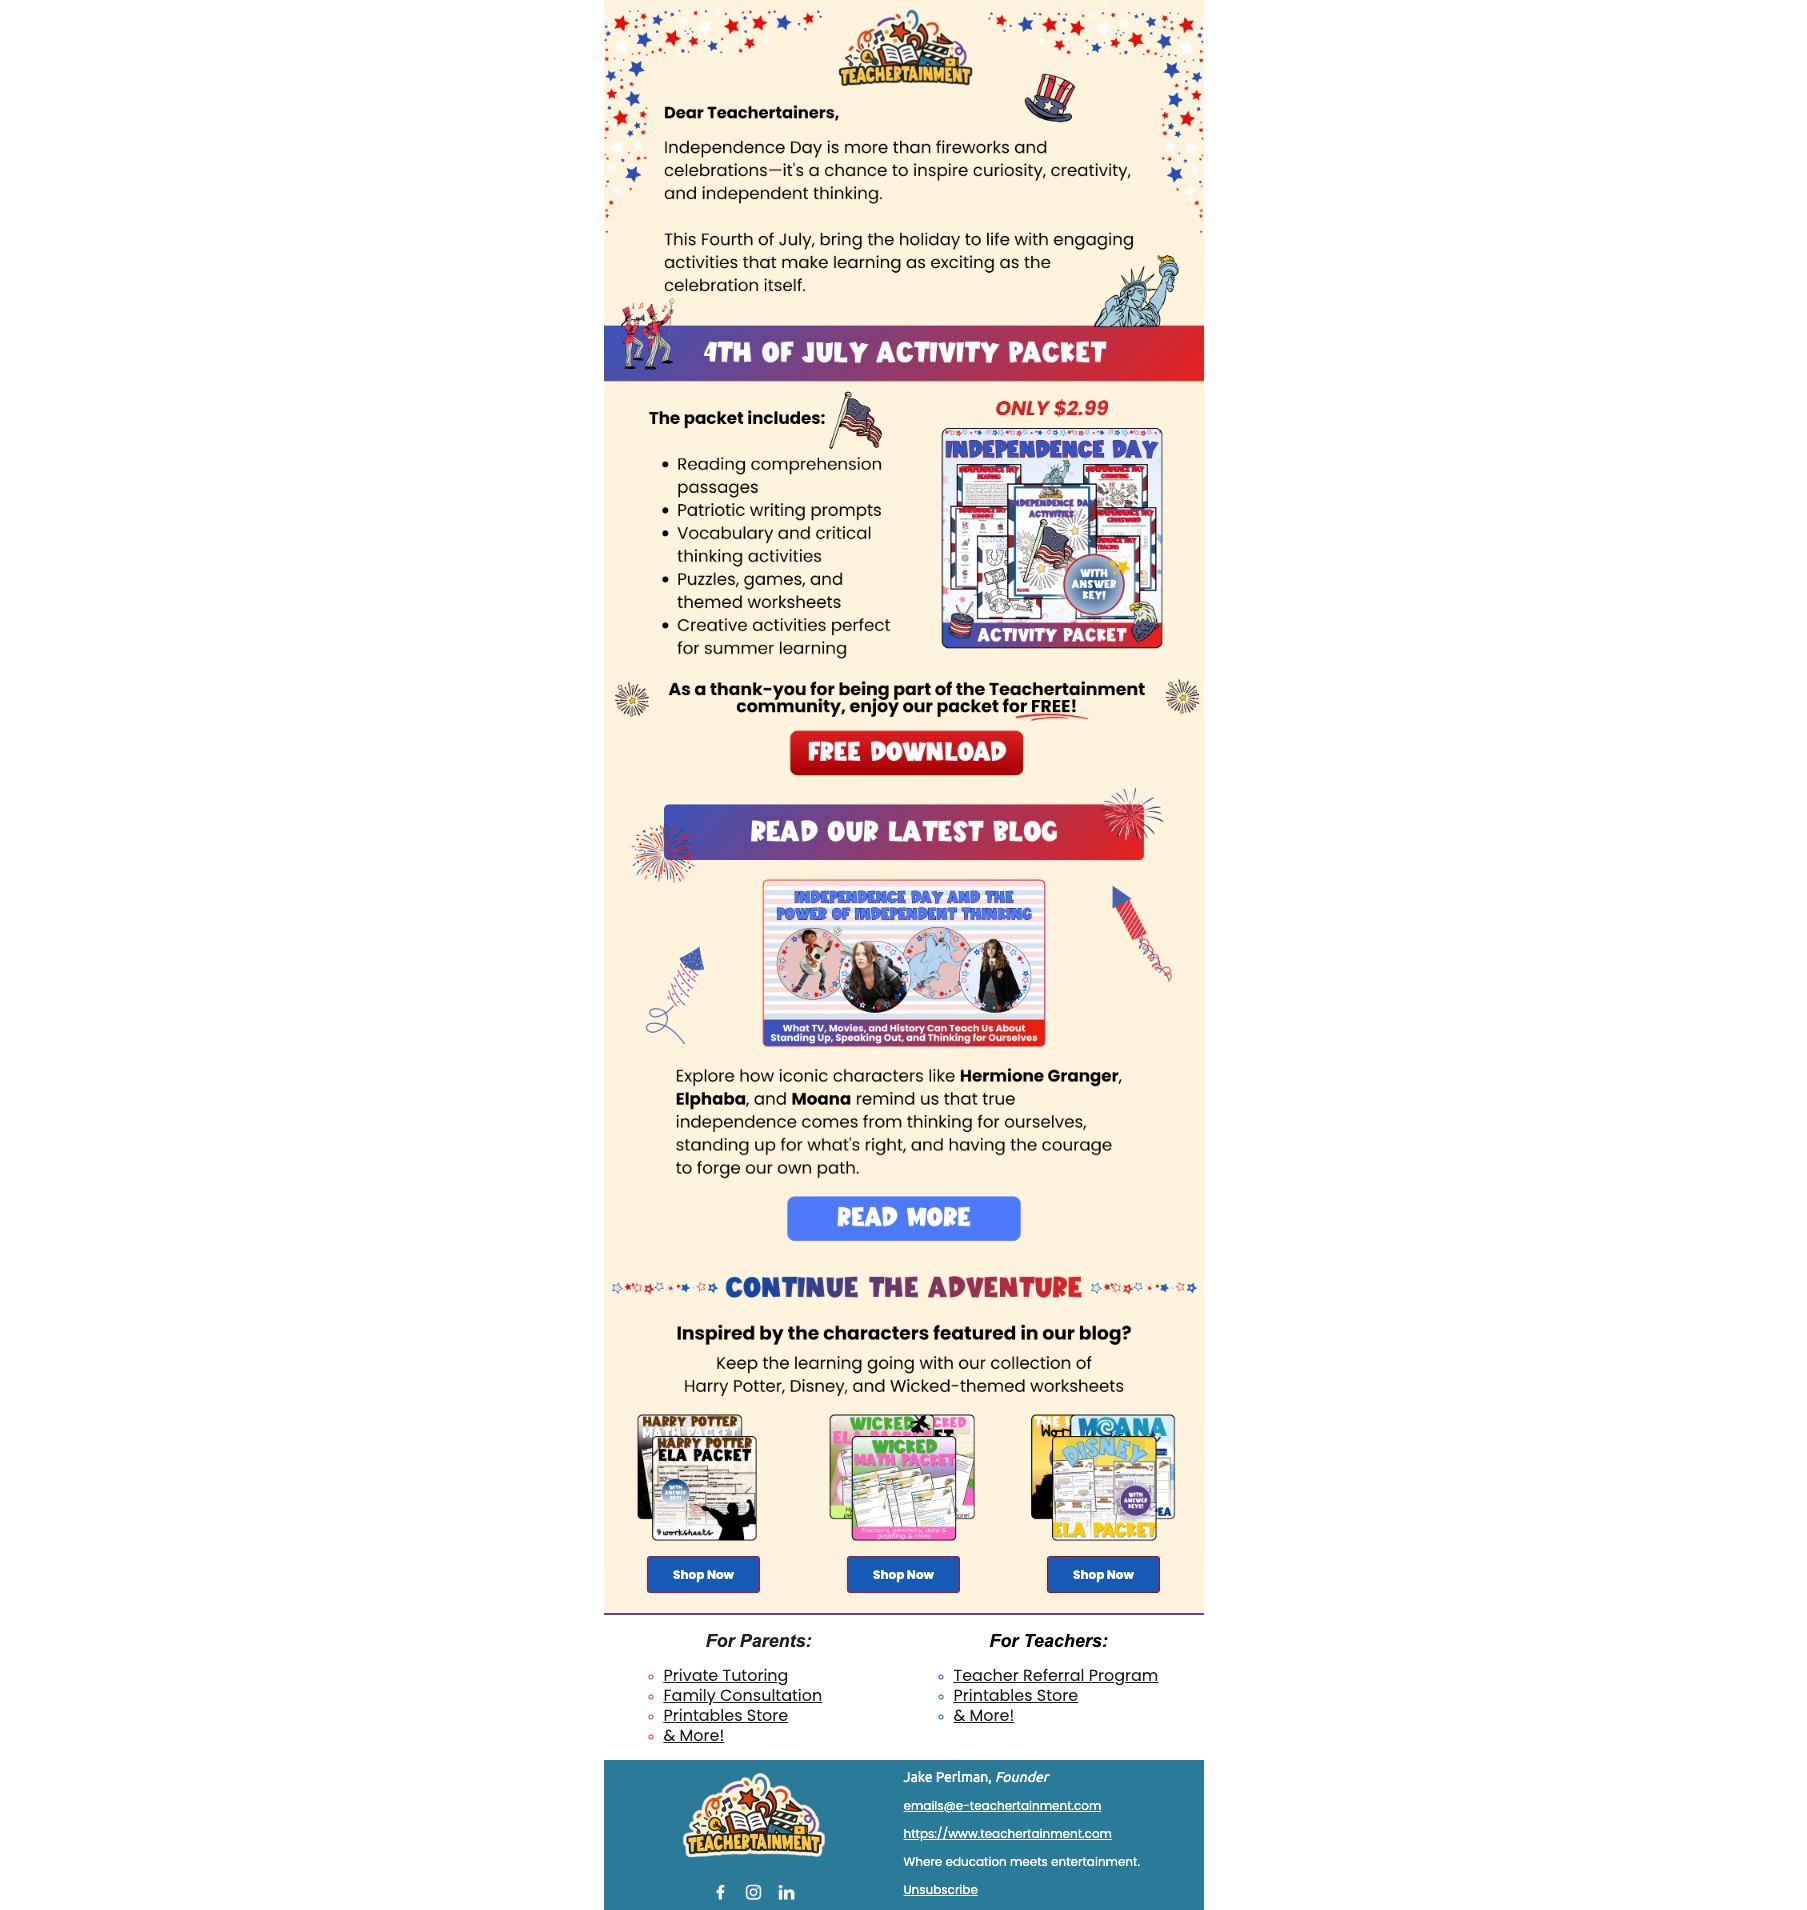
Email Creative
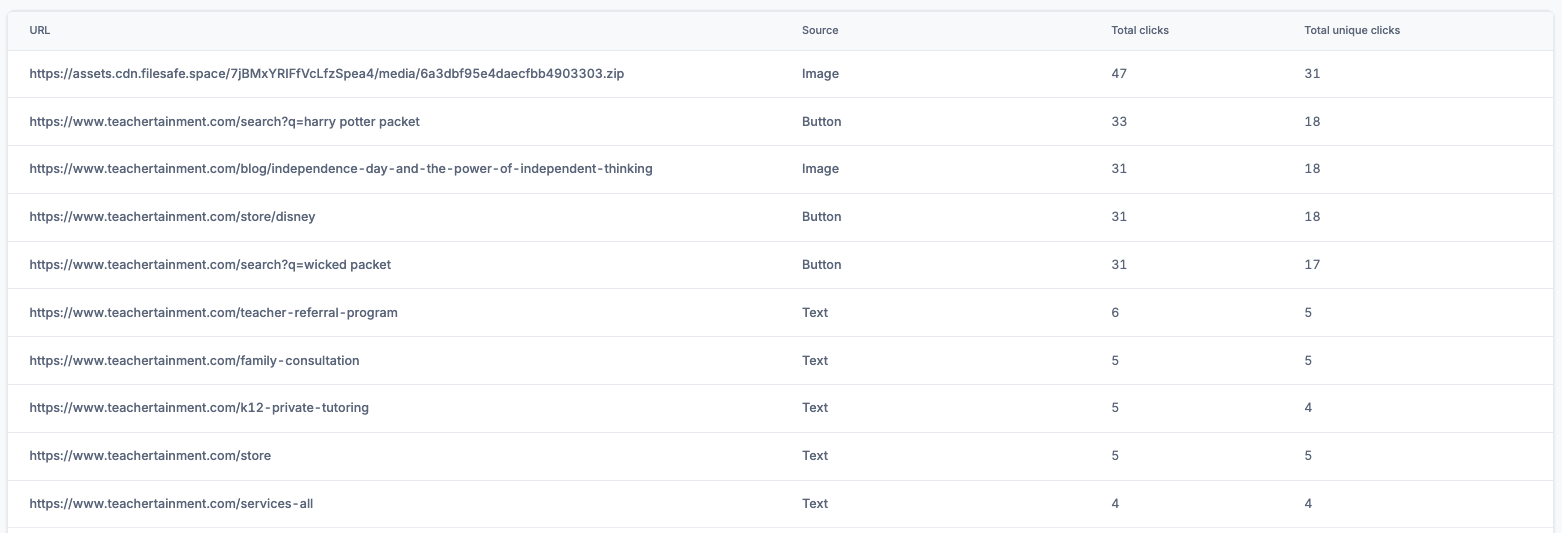
📊 Email Click Performance
Click performance breakdown from the Independence Day email campaign.
📝 Blog Content
New blog post published during this period.
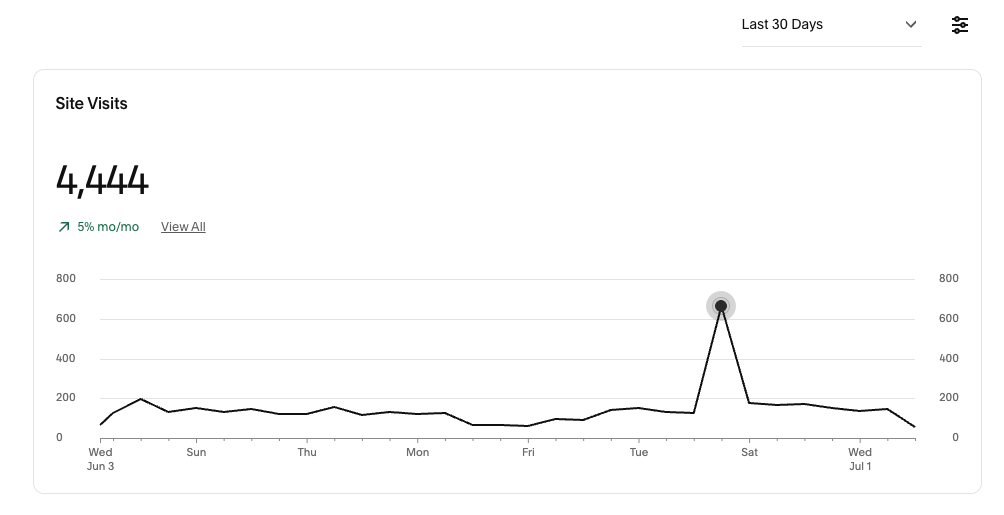
Site Visits (Last 30 Days)
4,444 total site visits, up 5% month over month.
Social Media
6 posts published across Facebook and Instagram during this period.


👥 CRM (GoHighLevel)
9+
New Contacts
10
Conversations
2
Live Chats
8
Automated Emails
| Activity Type | Count | Details |
|---|---|---|
| Email Conversations | 5 | Purchase confirmations, discount notifications, newsletter signups |
| Live Chat Sessions | 2 | Website visitor interactions via AI chatbot |
| Other Interactions | 3 | Form submissions, automated workflows |